

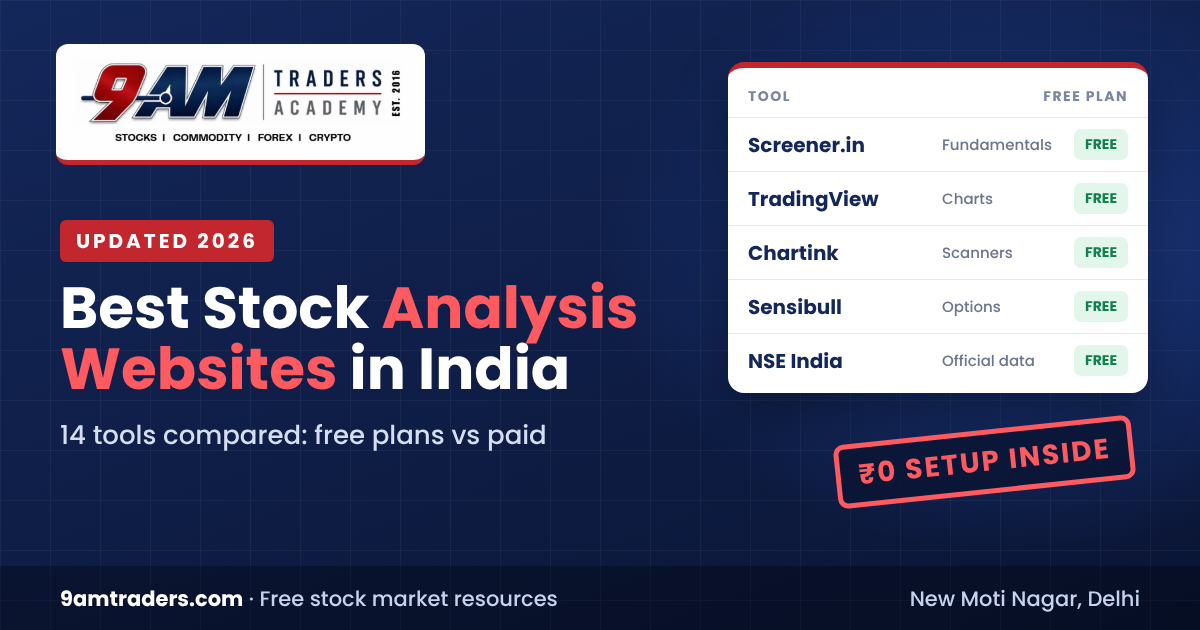
Best Stock Analysis Websites in India (2026): Free and Paid Tools Compared
Most traders don’t need ten websites. They need the right one for each job: one to understand the business, one to read the chart, and one for official data. This guide compares 14 tools on what is free, what costs money and what each is actually good at, then shows you a free setup that covers everything.
The short answer: which site for which job
Comparison table: free plans and prices
Filter by what you want to do. Prices were checked in October 2026 and change often with offers, so confirm on the tool’s own site before you pay.
| Tool | Best for | Free plan | Paid plan |
|---|---|---|---|
| Screener.in | Long-term stock research | Yes: 10 years of financials, custom screens, 50 follows | Premium ₹4,999/year |
| TradingView | Charts and technical analysis | Yes: 2 indicators per chart, 3 alerts, NSE data about 15 min delayed | Essential from ₹995/month (billed yearly) |
| Chartink | Technical stock scanners | Yes: scans with about a 5-minute delay | Premium about ₹780/month |
| Tickertape | Visual stock and fund snapshots | Yes: stock and fund pages, 170+ screener filters | Pro ₹399/month or ₹2,999/year |
| Trendlyne | Scores, results and broker targets | Yes: stock pages, DVM scores, results calendar | GuruQ from ₹390/month |
| StockEdge | Ready-made scans on your phone | Yes: basic scans, delivery and FII/DII data | Premium from ₹399/month |
| Moneycontrol | News, results and portfolio tracking | Yes: news, live prices, results, portfolio tracker | Pro plans, often on offer |
| Sensibull | Options strategies and payoffs | Yes: option chain, OI data, FII/DII | Pro about ₹1,300/month (free for Zerodha users) |
| Opstra (Definedge) | Option backtesting and volatility | Yes: basic option analytics | About ₹1,300/month |
| NSE India | Official prices, option chain, filings | Free, official | Free |
| BSE India | Company filings and results | Free, official | Free |
| Value Research | Mutual fund research | Yes: fund ratings, returns, portfolios | Stock Advisor ₹9,990/year |
| Chittorgarh | IPO dates, subscription and listing data | Free | Free |
| MarketsMojo | Stock ratings and calls | Limited | MojoOne about ₹9,999 a year (offer) |
The 14 tools, reviewed
Ordered from the tools most beginners need first to the more specialised ones. None of these companies pays us to be on this list.
1. Screener.in
Long-term stock researchThe fastest way to read a company: 10+ years of profit and loss, balance sheet, cash flow and ratios on one page, plus screens you write in plain formulas like ROCE > 20 AND Debt to equity < 0.5. The free plan is enough for most investors. Premium adds Excel export, more alerts and more peer-comparison columns.
- Free plan
- Yes: 10 years of financials, custom screens, 50 follows
- Paid
- Premium ₹4,999/year
- Use it for
- Long-term investing
2. TradingView
Charts and technical analysisThe charting standard. Draw trend lines and Fibonacci levels, add indicators like RSI and MACD, and replay old price action to practise. Free users get two indicators per chart and delayed NSE data; many Indian brokers build TradingView charts into their apps with live data, and some, such as Fyers and Dhan, connect directly to tradingview.com.
- Free plan
- Yes: 2 indicators per chart, 3 alerts, NSE data about 15 min delayed
- Paid
- Essential from ₹995/month (billed yearly)
- Use it for
- Intraday, Swing trading, Options and F&O
3. Chartink
Technical stock scannersBuild scanners like RSI crossed 60 and volume above 20-day average on NSE stocks, or use thousands of public scans other traders share. Free scans run about 5 minutes behind; premium is near real-time with 1-minute timeframes and alerts.
- Free plan
- Yes: scans with about a 5-minute delay
- Paid
- Premium about ₹780/month
- Use it for
- Intraday, Swing trading
4. Tickertape
Visual stock and fund snapshotsClean scorecards for each stock (performance, valuation, growth, profitability, entry point, red flags) and good mutual fund pages. Easier for beginners than Screener, with less depth. Pro unlocks premium screens and forecasts.
- Free plan
- Yes: stock and fund pages, 170+ screener filters
- Paid
- Pro ₹399/month or ₹2,999/year
- Use it for
- Long-term investing, Mutual funds
5. Trendlyne
Scores, results and broker targetsEvery stock gets Durability, Valuation and Momentum (DVM) scores, and you can track quarterly results, insider trades and analyst target prices. Useful for a quick read on quality before deeper work on Screener.
- Free plan
- Yes: stock pages, DVM scores, results calendar
- Paid
- GuruQ from ₹390/month
- Use it for
- Long-term investing, Swing trading
6. StockEdge
Ready-made scans on your phoneA mobile-first app with hundreds of ready-made technical and fundamental scans, sector rotation and FII/DII flow data. Good if you prefer picking from prepared scans over building your own.
- Free plan
- Yes: basic scans, delivery and FII/DII data
- Paid
- Premium from ₹399/month
- Use it for
- Swing trading, Long-term investing
7. Moneycontrol
News, results and portfolio trackingOne of India’s biggest market news sites. Use it for quarterly results, company news, a free portfolio tracker and the forums (read those with care). Pro removes ads and adds research ideas.
- Free plan
- Yes: news, live prices, results, portfolio tracker
- Paid
- Pro plans, often on offer
- Use it for
- Long-term investing, News
8. Sensibull
Options strategies and payoffsThe most popular options tool in India. Build a strategy, see its payoff chart, breakeven and Greeks before you trade, and paper-trade it. Zerodha customers get the full version free.
- Free plan
- Yes: option chain, OI data, FII/DII
- Paid
- Pro about ₹1,300/month (free for Zerodha users)
- Use it for
- Options and F&O
9. Opstra (Definedge)
Option backtesting and volatilityDeeper options analytics than most: implied volatility charts, strategy backtesting and a simulator. Better for traders who already know the basics.
- Free plan
- Yes: basic option analytics
- Paid
- About ₹1,300/month
- Use it for
- Options and F&O
10. NSE India
Official prices, option chain, filingsThe source every other site copies from. Use it for the official option chain, bulk and block deals, corporate announcements, IPO details and historical data. When two sites disagree, go with the exchange.
- Free plan
- Free, official
- Paid
- Free
- Use it for
- Intraday, Options and F&O, Long-term investing, IPOs
11. BSE India
Company filings and resultsEvery listed company files results, shareholding and announcements here, often within minutes. Read the original filing instead of a news summary when a stock moves.
- Free plan
- Free, official
- Paid
- Free
- Use it for
- Long-term investing, IPOs
12. Value Research
Mutual fund researchThe best free site for comparing mutual funds: returns across periods, expense ratios, portfolio holdings and star ratings. Its paid Stock Advisor service gives stock recommendations.
- Free plan
- Yes: fund ratings, returns, portfolios
- Paid
- Stock Advisor ₹9,990/year
- Use it for
- Mutual funds
13. Chittorgarh
IPO dates, subscription and listing dataThe go-to IPO reference: dates, price bands, lot sizes, live subscription numbers and listing history. Grey market premium figures shown on IPO sites are unofficial, so treat them as gossip, not data.
- Free plan
- Free
- Paid
- Free
- Use it for
- IPOs
14. MarketsMojo
Stock ratings and callsGives each stock a quality, valuation and trend rating and a buy or sell call. Use the ratings as a starting point, not as advice: check the numbers yourself on Screener.
- Free plan
- Limited
- Paid
- MojoOne about ₹9,999 a year (offer)
- Use it for
- Long-term investing
The ₹0 setup that covers everything
You can do serious research without paying anything. This free stack covers every step from idea to trade:
- Find ideas with a free Screener.in screen (investing) or Chartink scan (trading).
- Check the business on Screener: 10-year sales and profit growth, debt, return on capital and promoter holding.
- Time the entry on TradingView: trend, support and resistance, one or two indicators.
- Verify results and announcements on BSE or NSE, not on a forwarded message.
- Size the trade so one loss costs you 1–2% of capital at most. Our free option calculator shows breakeven and risk for options.
- Write it down in a trading journal and review it every weekend.
A 15-minute daily routine using these sites
Check global cues and the Market Mood Meter. Note any results or events on your stocks (Trendlyne or Moneycontrol calendar).
Run your saved Chartink or Screener scan. Shortlist no more than five stocks.
Open each on TradingView. Mark entry, stop-loss and target before the market opens at 9:15.
Check open interest on the NSE option chain and build the trade on Sensibull to see the payoff.
Log trades in your journal. Read why the market moved today and check bulk deals on NSE.
When a paid plan is worth it
Worth paying for
- Intraday traders: real-time scans (Chartink Premium) or live charts. A 5–15 minute delay is too slow for intraday.
- Active options traders: Sensibull Pro if your broker does not include it.
- Serious long-term investors: Screener Premium for Excel export and more alerts, at about ₹14 a day.
Usually not worth it
- Beginners: learn on free plans first. A paid tool does not fix a missing skill.
- Buy and sell calls: ratings and “expert picks” are opinions. Check any paid advice service is SEBI-registered on sebi.gov.in.
- Several tools at once: pay for one, use it fully, then decide.
Free tools from 9AM Traders Academy
We built these for our students. They are free, need no login and give no tips.
Frequently asked questions
Which is the best stock analysis website in India for beginners?
For a beginner, use three free sites together: Screener.in or Tickertape to understand the business, TradingView to read the chart, and NSE India to check official data. All three have free plans that are enough to learn on.
Which stock analysis websites are completely free?
NSE India, BSE India and Chittorgarh are fully free. Screener.in, TradingView, Chartink, Tickertape, Trendlyne, StockEdge, Moneycontrol, Sensibull and Value Research all have free plans that cover most needs; their paid plans add speed, alerts, exports and extra filters.
Is Screener.in better than Tickertape?
Screener.in is better for depth: 10+ years of financials and custom formula screens. Tickertape is easier to read, with visual scorecards and good mutual fund pages. Many investors use Tickertape for a first look and Screener for the full check.
Is TradingView free in India?
Yes. The free Basic plan lets you chart any NSE or BSE stock with up to 2 indicators per chart and 3 price alerts, with NSE data delayed by about 15 minutes. Paid plans start at about ₹995 a month when billed yearly. Many Indian brokers build TradingView charts into their apps with live data.
Which website is best for options trading analysis?
Sensibull is the most popular for building strategies and seeing payoff charts, and it is free for Zerodha customers. The official NSE option chain is free and is the most reliable source for open interest. Opstra suits advanced traders who want volatility charts and backtesting.
Can I rely on these websites for buy and sell decisions?
No. They give you data, scores and charts, not advice. Ratings and screens are a starting point. Check the company’s own filings, understand the risk, and size every trade so that one mistake cannot hurt you badly.
Do I need to pay for a stock analysis tool?
Not to start. Free plans are enough to learn and to invest long term. Pay only when a specific limit slows you down, for example delayed data for intraday trading or too few alerts, and pay for one tool at a time.
This page is for education only and is not investment advice. 9AM Traders Academy has no paid or affiliate relationship with any tool listed. Features and prices are as published by each provider or reported in October 2026 and can change at any time. Also read: best stock brokers in India and how to avoid stock market scams.